Vacation Rental Industry Trends:
Fall 2022
Economic headwinds haven’t stopped short-term rental growth — but they have changed the landscape.
The past two years were abnormal in their own ways for the vacation rental industry. As an owner, your revenue may have suffered in 2020, only to bounce back better than ever in 2021.
That can make it tough to know what’s good and what’s not when moving into the tail-end of 2022. But if there’s a single constant about the vacation rental industry, it’s that it’s always changing.
The market has changed from what it looked like those last few years. It’s different from what it was in summer 2022. And, to be honest, it’s changed from what it was even a month ago.
Recently, mortgage rates jumped to nearly 7% for the first time since 2001. Inflation is at an incredibly-high 8.2%. And interest rates are on the rise, sitting between 3 and 3.25% with the Federal Reserve saying they’re likely to go up another 0.75% in November.
All of this happened within a matter of weeks — and that can dramatically impact daily, monthly, and annual performance for vacation rental owners as we head into the holidays.
Your Seasonal Snapshot
Here’s a performance overview* through September 2022:

Market Supply
(available listings)

Market Demand
(total nights booked)

Evolve Total Revenue
per Property
As you can see, market supply has grown at a faster rate than market demand in the past year. When that’s paired with Evolve’s strong 2021 performance (see “From the Archives” for more details) and current economic headwinds, it directly contributes to total revenue per property being down year over year (YoY). However, it’s significantly higher than it was compared to 2019.
Why do we look at 2019 data? When there’s an anomaly of a year like 2021 — a time when the vacation rental industry saw unprecedented growth in demand per available property — evaluating YoY data alone can skew the performance picture. And, since 2020 was another outlier year, 2019 data provides a more stable baseline that allows us to see performance more holistically.
When we do this, the picture is clear: Evolve owners are doing great compared to pre-pandemic performance.

Both 2021 and 2022 have experienced significant growth compared to 2019. And in some months (January-April), owners actually earned more this year compared to last.
Now, let’s dig into the nitty-gritty of why 2022’s growth numbers have slowed over the second half of the year.
Supply & Demand
Through May 2022, we reported market supply growth was increasing month over month (MoM) while market demand growth was quickly decelerating — particularly once signs of inflation started to appear.
This trend continued into summer, and in June we saw demand growth fully slip below supply growth’s trendline.

Supply growth kept moving higher into the double digits MoM, while demand growth shrank comparatively.

This created stiffer competition in the marketplace, as more homes were vying for bookings. For many, that meant occupancy levels decreased YoY on a per property basis.
None of this indicates the vacation rental industry is moving in the wrong direction. In fact, the market is hotter than ever, as both supply and demand are growing. So more people are realizing the benefits of a vacation rental investment and more people are booking than ever before.

It’s just that supply growth is outpacing demand growth — and that naturally comes with more competition at the individual property level.
However, we can’t ignore the economic headwinds that are having an impact. Owners need to do everything they can to capture these highly sought-after bookings — including partnering with trusted experts who adjust revenue optimization strategies in step with market conditions — to come out ahead of the competition.
Average Daily Rates
While 2022’s storyline shows market supply growth outpacing market demand growth, the opposite was true in 2021. In May of last year, demand growth peaked at nearly 72% YoY while supply growth was about 12% YoY at that time. This presented a unique opportunity to hold higher ADRs and still be super competitive in the market.
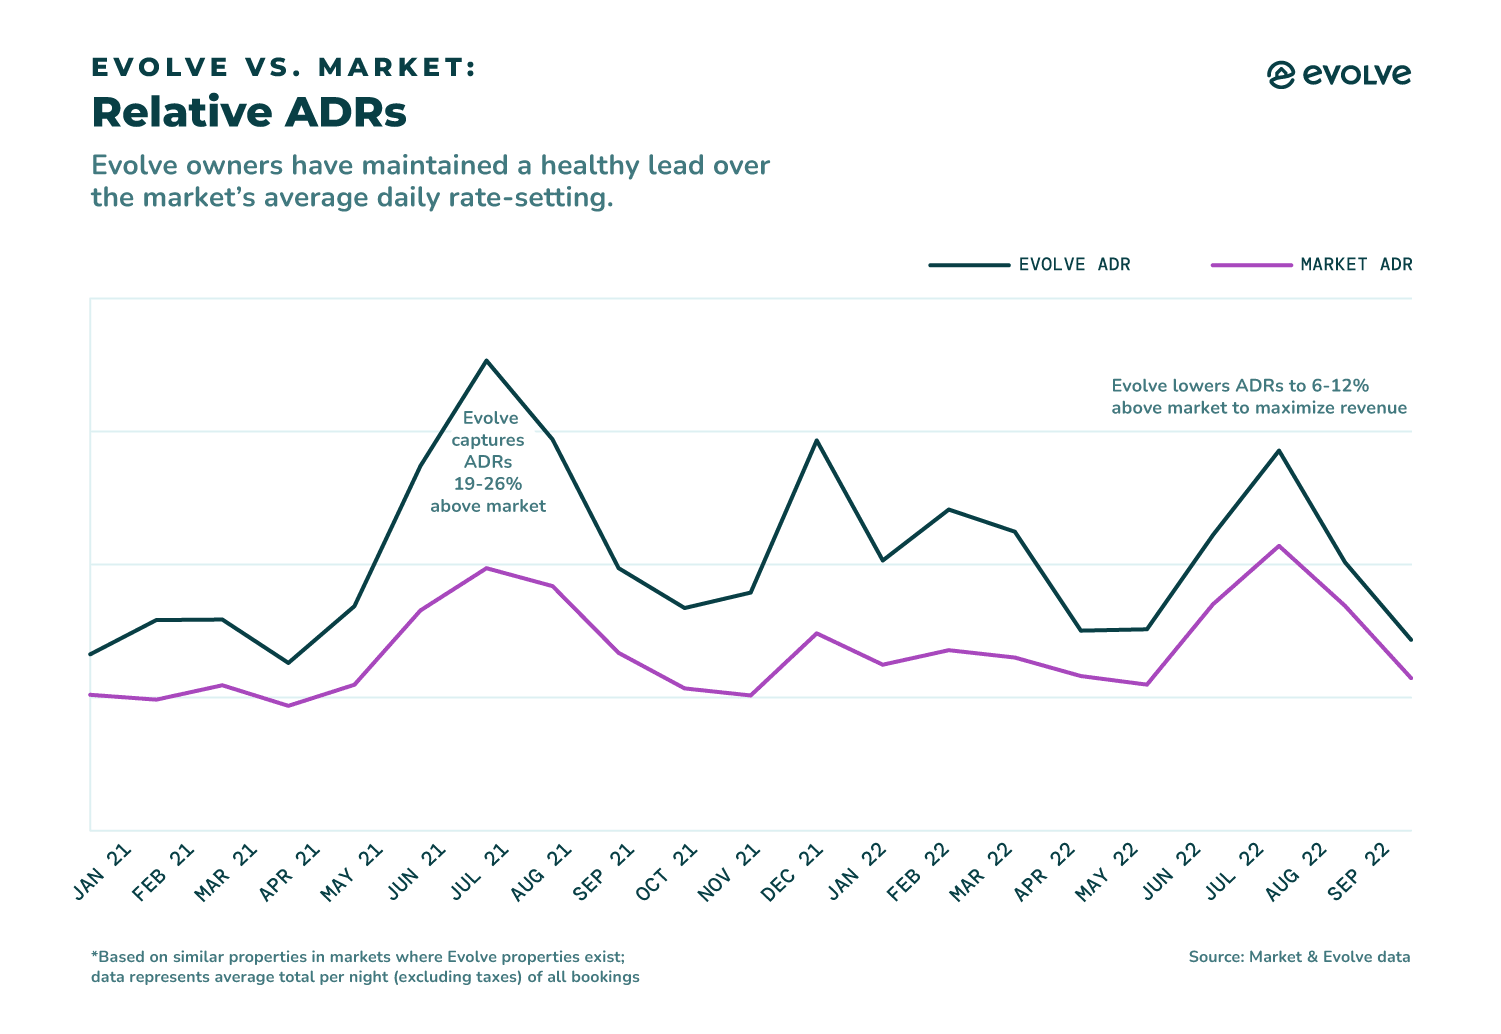
Evolve did just that, pushing higher rates in early 2021 because our data showed there would be more guests booking last-minute trips as we moved into summer. The same cannot be said for the broader market, as many owners and property managers underestimated that last-minute demand and instead opted to capture bookings at lower price points earlier.
As a result, Evolve homes achieved 26% higher ADRs in July 2021 alone, and an average of 21% higher ADRs from June through August.
This more significant gap ahead of the market carried into early 2022. Then, as supply and demand trends shifted, so did revenue strategies in order to remain competitive.
This is when it makes a big difference whether you’re an Evolve owner or not. Various market reports note ADRs are up YoY — and those who are not Evolve owners may see personal performance align with that reporting.
But if you’re an Evolve owner and experienced the higher-than-market ADRs seen above, you may see lower YoY ADRs. Still, Evolve owners have never had lower ADRs than the market.
Plus, when you step back to analyze performance against 2019, you once again see the full picture of growth.

There was growth in base revenue per property across the board since April 2021 (and even earlier for Evolve specifically). What’s more: Evolve’s 2021 peak in September saw over 106% increases in base revenue compared to 2019, while the market sat at just under 39% growth.
September 2022 shows history repeating itself: Evolve locked in 75% base revenue growth compared to 2019, while the market saw only 23% increases — once again putting Evolve owners well ahead of the market and successfully minimizing the impact of trying economic conditions.
Booking Windows
At the beginning of 2022, a significant number of guests were booking last-minute (within 14 days of check-in). The volume of travelers doing this kept increasing MoM, while those planning further out continued to shrink.
A subtle trend reversal began in mid-April as economic concerns surfaced. But it wasn’t until mid-June that a dramatic switch occurred — the growth of bookings for pre-planned trips (60+ days) spiked, reaching a 62% YoY increase in September, while last-minute reservations plummeted to -20% YoY. (Bookings in the 15- to 59-day range also dipped, though not as dramatically.)

This makes sense, as this is right when inflation spiked to 9.1%, hitting a 40-year high thanks to significant jumps in gas and energy prices, as well as consumer goods.
As these trendlines flipped, ADRs needed to as well — which is why, for both Evolve and the market, rates quickly began decreasing. The goal: rather than relying heavily on bookings coming in last-minute (a strategic move that made sense for market conditions at the time), pricing should be set competitive enough to capture more bookings in each booking window.
With booking patterns changing as quickly as they are, it’s important to note these strategies may have shifted once again from the writing of this report — and what we’re seeing may or may not continue for the remainder of the season. That’s why it’s critical to work with a team of experts who catch these trends and keep you on track no matter what the booking conditions look like.
How Evolve Is Responding to the Market
While the vacation rental industry is always going to be in flux, right now it’s changing incredibly fast — making it more important than ever to have a team that can stay tuned in, adapt your property’s revenue strategy appropriately, and keep your home ultra-competitive.
A few ways Evolve does this:
- Monitoring and adjusting rates when and where demand has slowed and/or spiked, an indicator of how likely bookings will come in at certain times
- Adjusting length of stay restrictions to provide guests flexibility and further encourage bookings
- Advising on absolute minimum rate and absolute minimum stay settings to help maximize revenue
- Expanding listing distribution to continuously increase your home’s exposure
We never apply a “set it and forget it” approach — and our success strategies are unique. That’s why, as the data shows, our owners perform better.
Regional Considerations
With the overarching picture of vacation rental industry trends painted, let’s dive into the details that can still vary from location to location.

Remember, homes in different parts of the country can perform similarly to those outside of their geographic region. For example, while a home in Utah is geographically in the Southwest, it can perform like a home in Washington that’s geographically in the Northwest. This is because these two locations have similar activities and interest for guests, so demand — and ultimately revenue — may look similar.
Check out our summer report for a refresher on how homes across regions may perform differently based on seasonal demand.
Northeast Trends
While summer was in full swing, vacation homes in states with popular beaches saw total occupancy levels that were similar to last year, while those more geographically focused around mountains and lakes trailed behind.
But, ADRs needed to be lowered in order to reach that occupancy while competition became increasingly more fierce. Not quite as low as other regions — mainly because they already have high volumes of supply with little room to expand. This, coupled with the reality that guests booking during peak season are used to seeing high ADRs in these areas, meant rates could be held closer to last year’s performance.
Moving into fall, guests are booking trips an average of 58 days ahead of check-in. So it’s best to list at an enticing ADR sooner to lock in bookings from the pre-planners and fill the calendar.
This region also tends to see a lot of interstate travel, with the vast majority of guests being within driving distance. So lowering rates for those interested in last-minute getaways (the fall foliage in the northeast is stunning) can also help boost bookings when your home may have otherwise sat empty.

Locations seeing strong success:
- Cape Cod, MA
- Ocean City, MD
- Lakes Region, NH

Locations trailing behind:
- Poconos, PA
- Catskills, NY
- Eagle River, WI
Southeast Trends
Homes in this region are still seeing slower demand this year compared to last. Travelers are less interested in visiting the super rural, off-the-grid locations that were popular through much of 2020 and 2021, in favor of visiting more well-known destinations in the area.
From June to September, this was primarily centered around waterfront locales as families prioritized weekend beach trips. And when listed at the right price, some homes were able to entice guests to stay longer.
Right now, guests aren’t nearly as interested in booking last-minute trips as they used to be, particularly as inflation rises and travelers get more cautious with their spending. The average booking window is around 33 days, but many are also booking more than 60 days out. So as the seasons shift, it’s important to keep rates competitive (and flexible!) to help guests feel confident they can afford a trip and convince them to book your home over someone else’s.
Locations seeing strong success:
- Carolina Beach, NC
- Lake of the Ozarks, MO
- Myrtle Beach, SC
Locations trailing behind:
- Northwest High Country, GA
- Blue Ridge Mountains, NC
- Broken Bow, OK
Northwest Trends
Popular mountain destinations saw strong success this summer, with many homes performing similarly to last year. Like the southeast, however, lesser-known locales needed to drop their ADRs in order to convince guests they should visit and boost bookings amidst a faster supply growth.
Most of the hotspots in this region are known for outdoor offerings, which is ideal for weekend warriors looking to spend time in nature. So ADRs tend to be higher on weekends (when bookings are more likely to lock in), with lower ADRs offered during weekdays to potentially turn that two-day trip into a three- or four-night stay.
As ski season approaches and there’s a stronger appetite for planning, guests are booking an average of 40 days in advance. To help make sure your home hits its peak, an open calendar (aka fewer owner blocks) and looser length-of-stay restrictions can make your property appealing to a variety of travelers.
Locations seeing strong success:
Locations trailing behind:
- Taos, NM
- Brian Head, UT
- Yellowstone, MT
Southwest Trends
Travelers exploring this region tend to love making last-minute plans, but the tendency to plan has been increasing — the average guest booked 42 days out in September — as travel trends shift closer to what was seen in 2019 (an average of 50 days in this region).
Economic concerns are also at play in the southwest. On the one hand, many vacation destinations here are within a one- to three-hour drive of a major city. This makes planning more simple, as guests don’t typically have to worry about air travel or car rentals.
However, high gas prices make people less likely to fuel up for an adventure. So while last-minute trips are still likely to happen, they may be less frequent — and homes need to be listed at competitive rates sooner to convince guests a weekend getaway (or longer!) is worth the pain at the pump.
Locations seeing strong success:
Locations trailing behind:
South Trends
Summer saw generally high last-minute demand in the south, with many guests booking trips less than 30 days ahead of their arrival. With 2021 being a record-breaking year for many, those bookings did lock in at rates that were a bit lower than last year due to economic shifts. But when we look at 2019 in comparison, total revenue per property still increased a significant amount.
As we move into cooler months, this area is less likely to have families with young children visiting — and more likely to see guests who are interested in snowbird travel making reservations. Many are planning trips earlier (on average, 55 days of check-in), and with inflation and holiday spending top of mind, it’s important to have your home priced competitively to try to fill the calendar.
Locations seeing strong success:
Locations trailing behind:
*When evaluating vacation rental market data, Evolve looks at a subset of the U.S. market to compare against properties that are most similar to those Evolve manages. This is in an effort to remove any data bias and avoid misrepresentation of trend and performance comparisons that could be created by comparing properties that are not “like-for-like” with Evolve’s. “The Market” includes those in counties Evolve properties are located in. Within each county, the properties must be of similar types and bedroom counts, have similar minimum night stay policies, and have the entire home available to rent privately. Vacation rentals with dissimilar features — like those only offering shared rooms or any with 30-night minimum stay requirements — are not included in this data set.